A local system that turns your facility's data into meaning.
Three layers in a single system — real-time monitoring, facility memory, and a growing data asset. None of them depend on the internet.
Real-time monitoring
Listens to sensors second by second. Raises alarms on threshold breaches; with machine learning, it catches behavior that deviates from each asset's own normal.
Facility memory
Stores high-resolution data in your facility for years. 1 year raw, 3 years minute-based, unlimited hourly — go back in time whenever you need.
Your data asset
The data you accumulate becomes a solid foundation for your sustainability reporting, energy-efficiency studies, and R&D projects.
Smart monitoring in three steps.
This entire process happens in a single local system, without leaving your facility.
Reads the data
Reads data from your sensors and automation system. Uses industry-standard communication; connects in parallel to your existing infrastructure.
Produces meaning
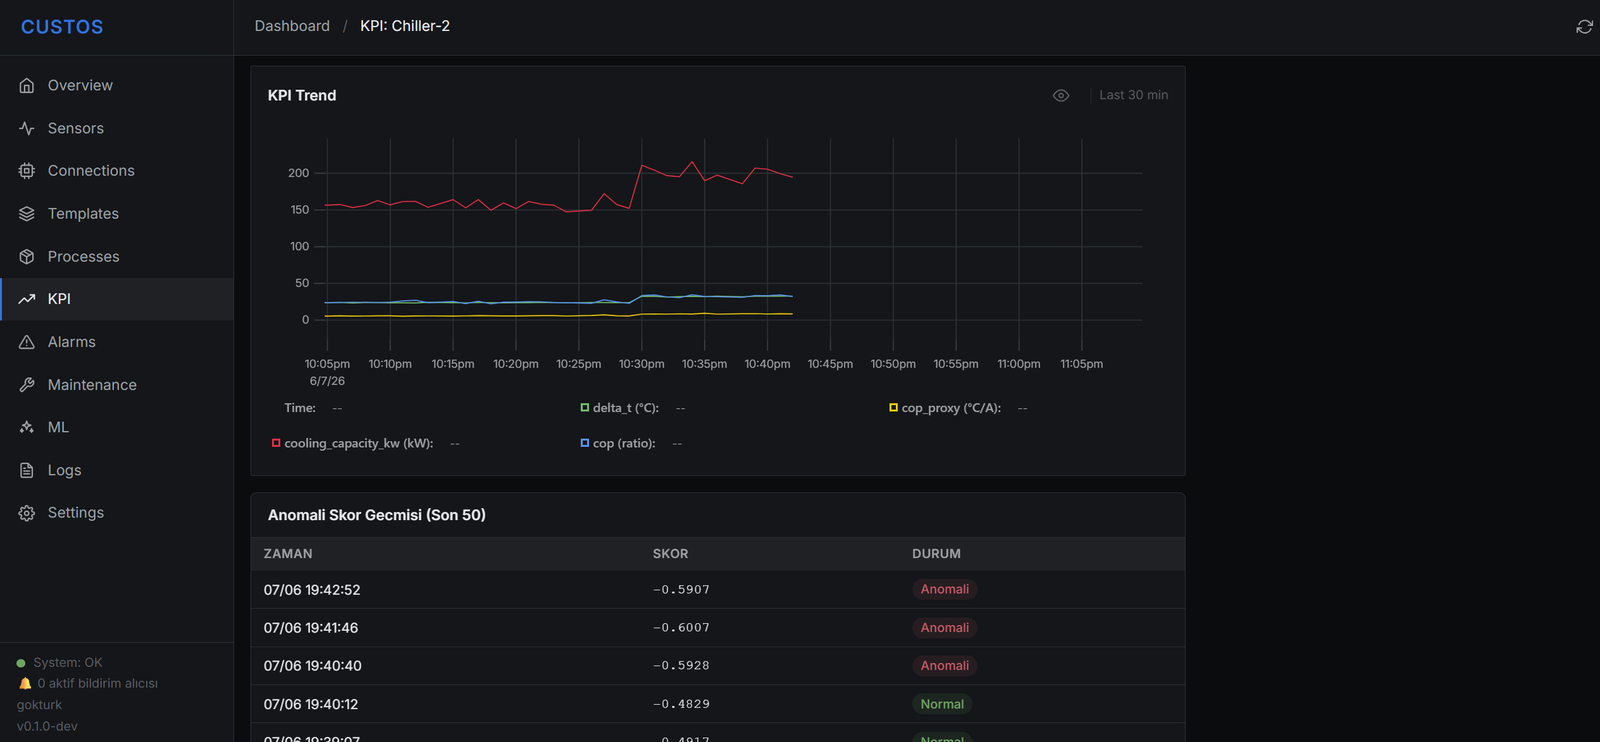
Turns raw data into meaningful information with equipment templates, KPI calculations, and machine-learning models. Learns each asset's own normal.
Guides the operator
Alarms, the maintenance checklist, and the technical assistant are presented together. When you want to look back, all the data is already there.
Catching a failure before it happens.
Smart alarms, solutions, and an advisor in one place.
Knowledge lives in the system, not in individuals. Even when the team changes, the knowledge isn't lost.
Alarm
Not just "something happened" — which equipment, for how long, how serious, and whether there's a precedent.
Maintenance checklist
After an alarm, the steps for the technician are presented in order: "First check X, then measure Y…"
- Filter status checked
- Valve position verified
- Pressure measurement
Technical assistant
Natural-language Q&A; the system answers from its own knowledge base.
Today's monitoring tool, tomorrow's data source.
Raw data at second-level resolution. Keeps every single reading.
Minute-level summaries. The ideal resolution for trend analysis.
Hourly summaries kept without limit. For looking back.
Energy efficiency
Comprehensive analysis of your consumption patterns, with optimization opportunities.
ESG / CBAM reports
An evidence-based data foundation for sustainability reporting.
Equipment lifecycle analysis
Which equipment has worn how much, and when it should be replaced.
Failure prediction models
Predicting future failures from past failure signals.
What's inside Custos?
Automatic sensor discovery
Connect the device and the system recognizes active sensors on its own.
Equipment template library
HVAC, pump, motor, compressor, cooling, AHU, chiller, FCU.
KPI calculation engine
Template-based performance indicators are generated automatically.
ML-based anomaly detection
Each asset learns its own normal; deviations are caught.
ISA-18.2 alarm lifecycle
Active, acknowledged, cleared — full traceability.
Maintenance module & checklist
Periodic maintenance calendar, step-by-step instructions after an alarm.
Technical assistant chatbot
Natural-language Q&A; the system answers from its own data.
Long-term trend with unlimited zoom
From seconds to years, navigate the past from a single interface.
Automatic monthly archive (open format)
Vendor-independent, readable for years to come.
Let's see the value it brings to your operation.
Let's assess how Custos fits your equipment and your needs in a preliminary call.