The screen the operator sees.
Critical sensors, alarms, KPIs, and long-term trends — all in a single interface that opens in the browser. No extra software to install.
Your entire facility on one screen.
Critical sensors, open alarms, KPI summaries, and consumption on one screen. The operator opens the interface and checks the facility's pulse in ten seconds.
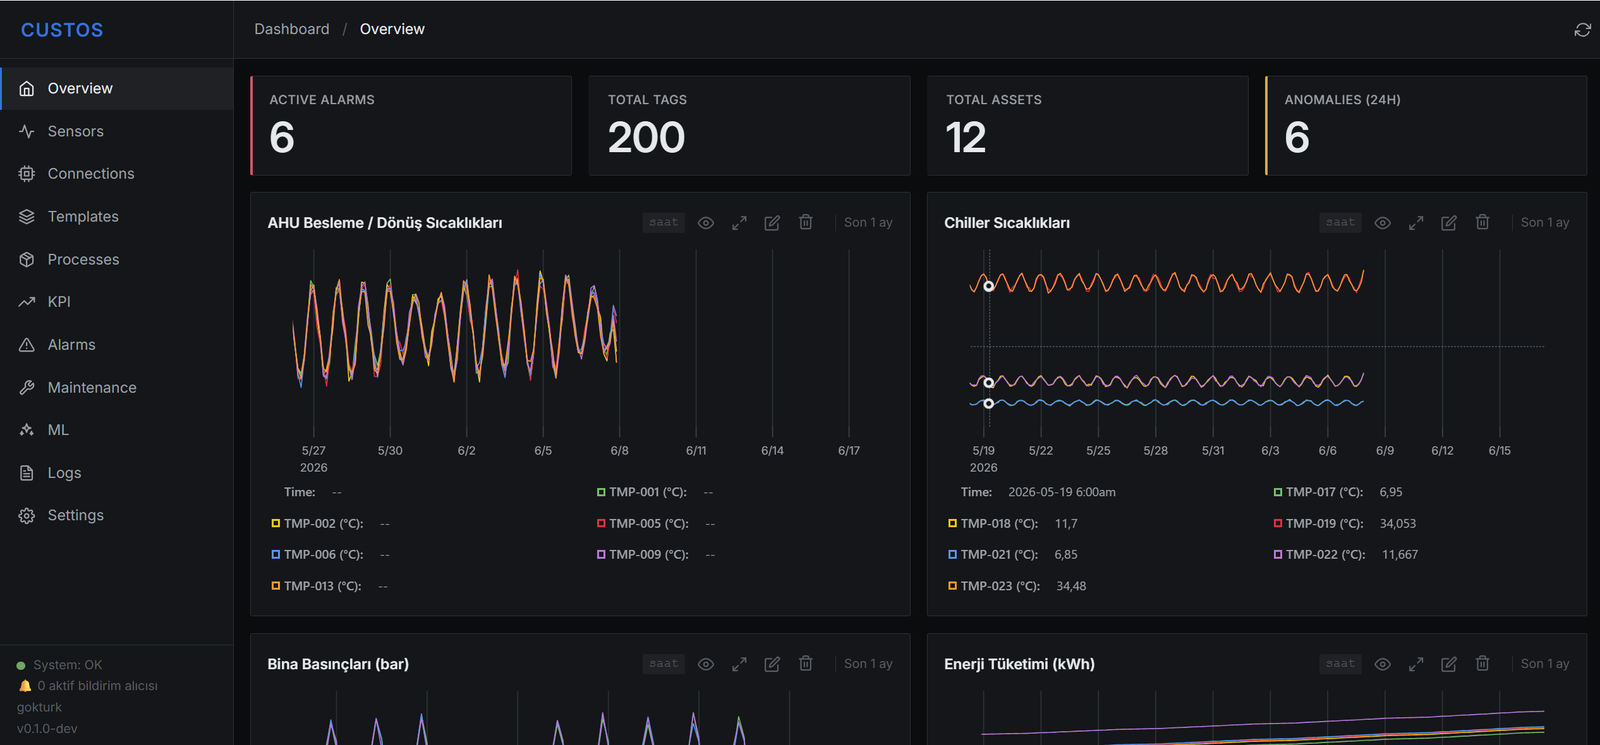
Go back as far as you want.
From seconds to years, navigate the past from a single interface. With unlimited zoom, trace step by step exactly when a change began.
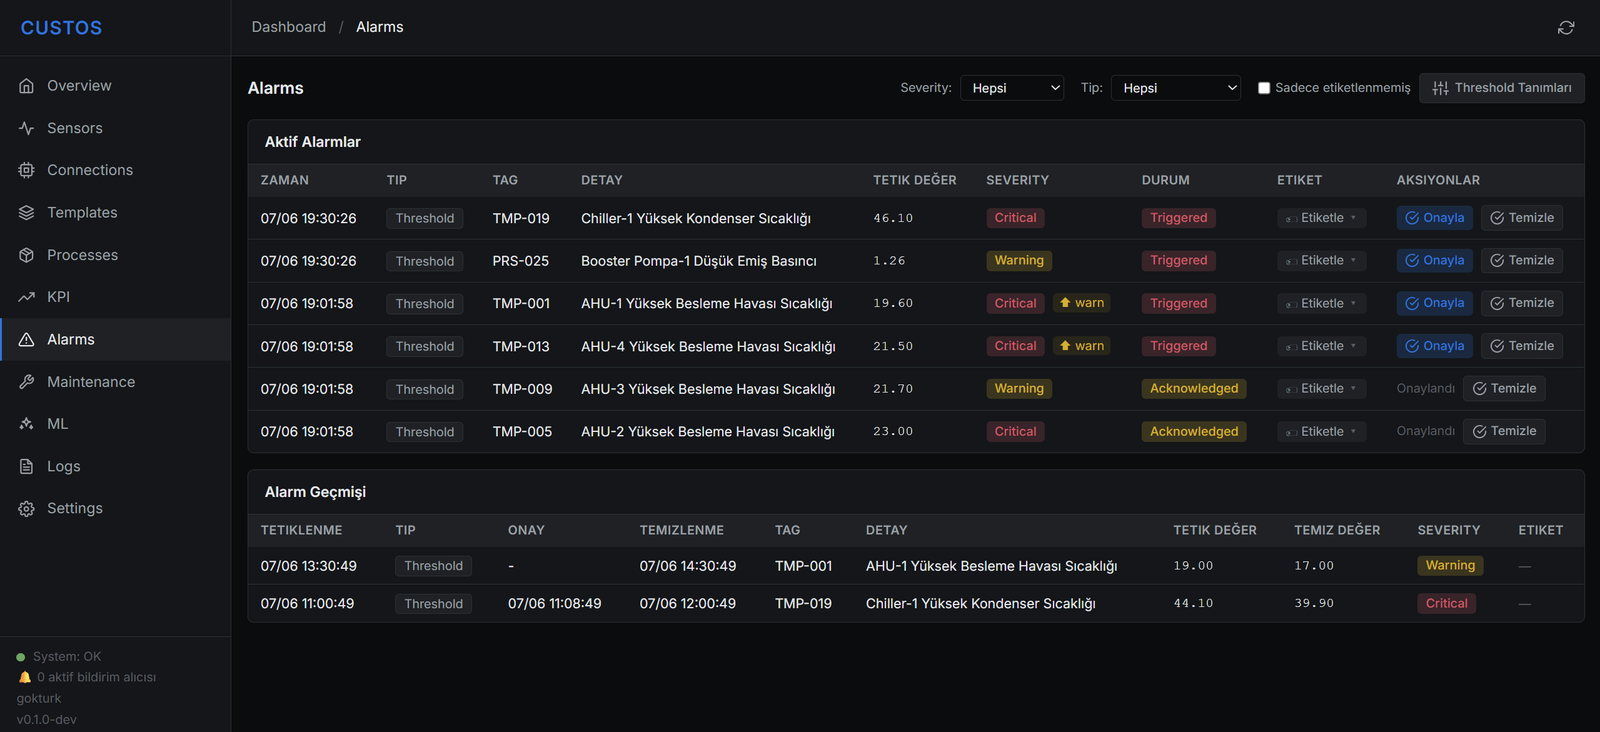
Not alarm noise, but meaningful warnings.
Alarms are managed by lifecycle: active, acknowledged, cleared. Severity, source equipment, and first-trigger time are always visible.
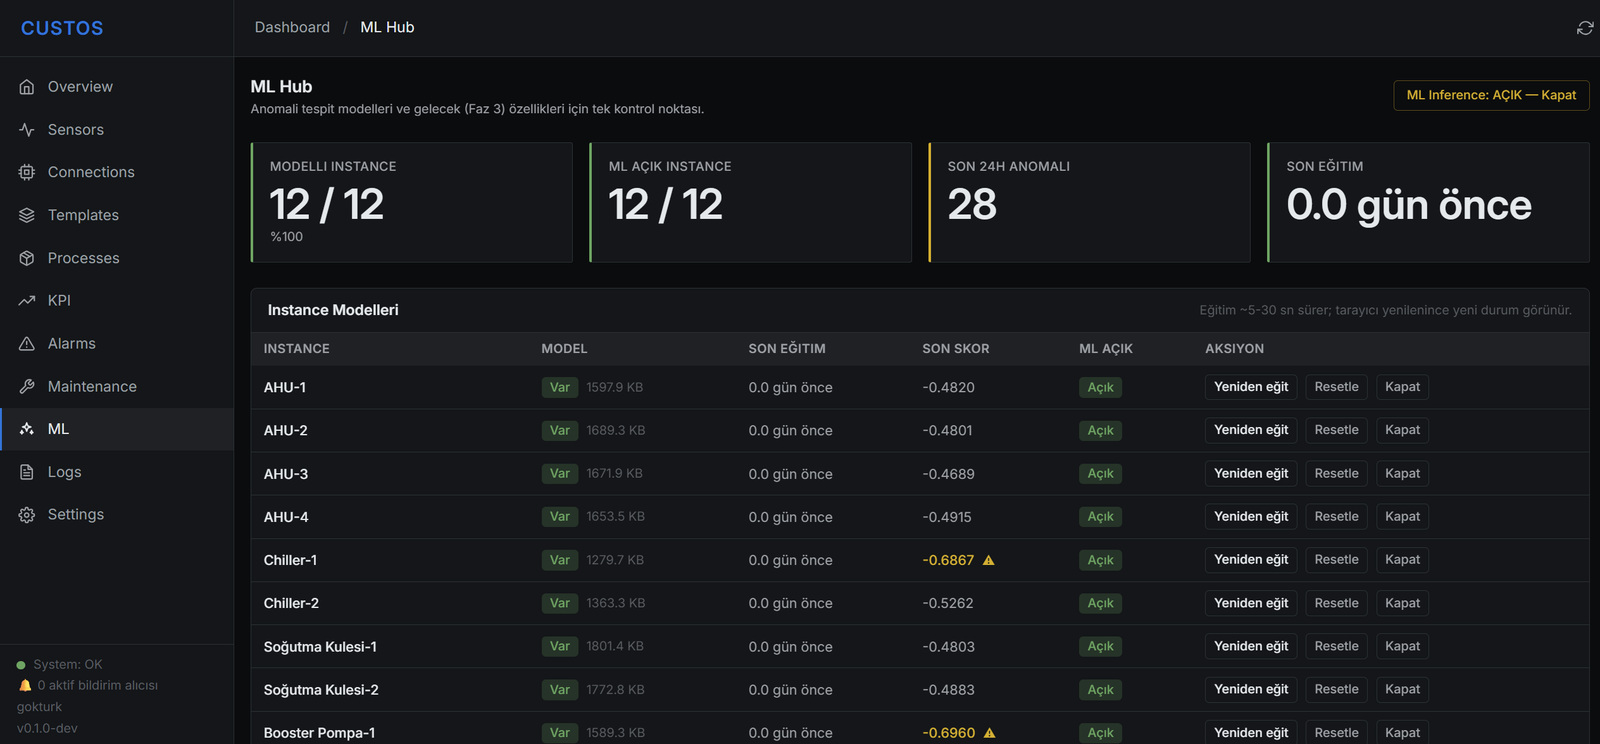
Each asset learns its own normal.
Models are trained per asset; the further a deviation is from normal, the more attention it draws. You see transparently which model is active, when it learned, and its results.
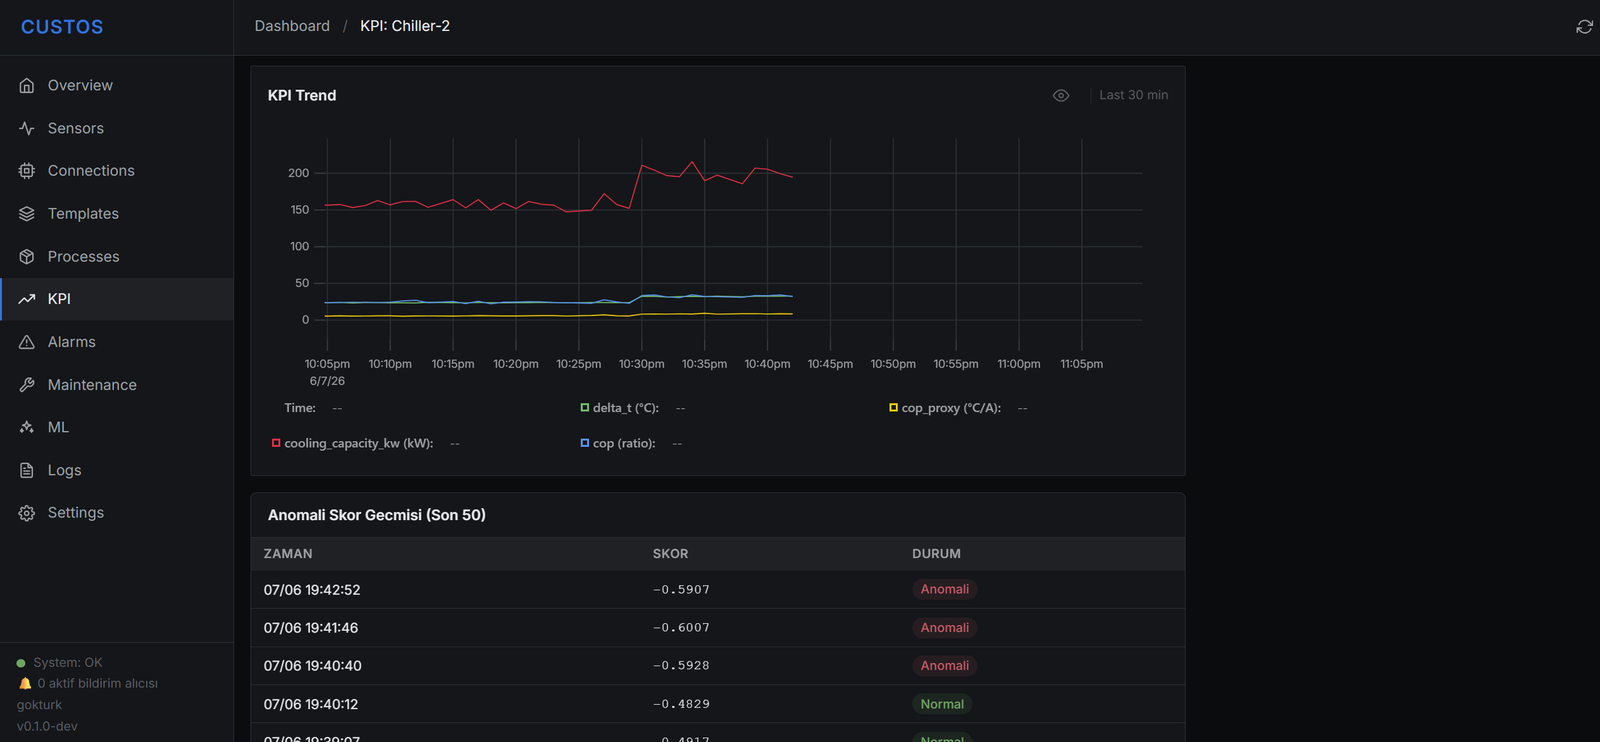
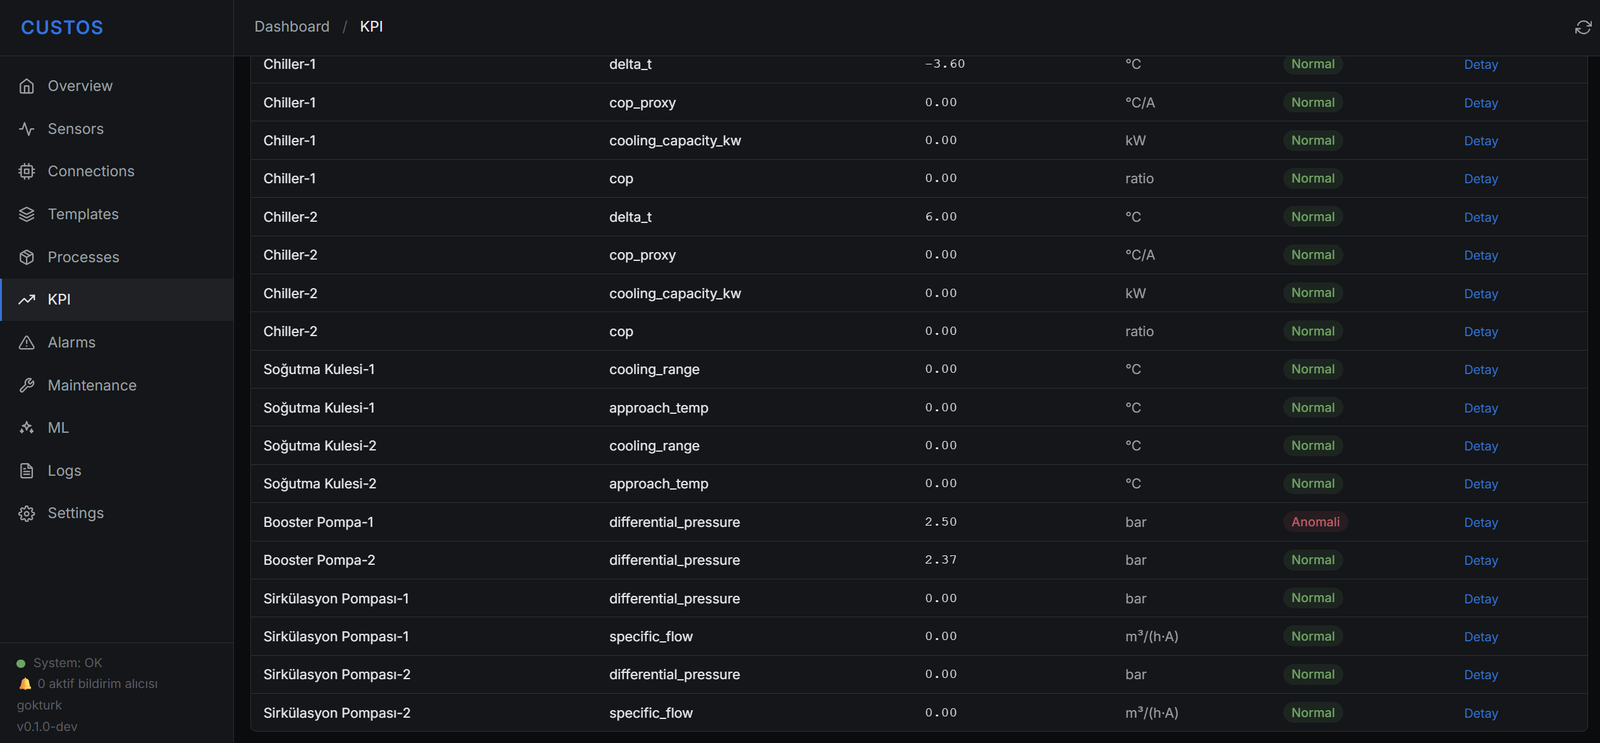
Not raw data, but meaningful performance.
For each asset, derived indicators such as efficiency, temperature difference, and pressure differential are calculated automatically. Any value outside the normal is flagged instantly — you see the real situation behind the numbers.
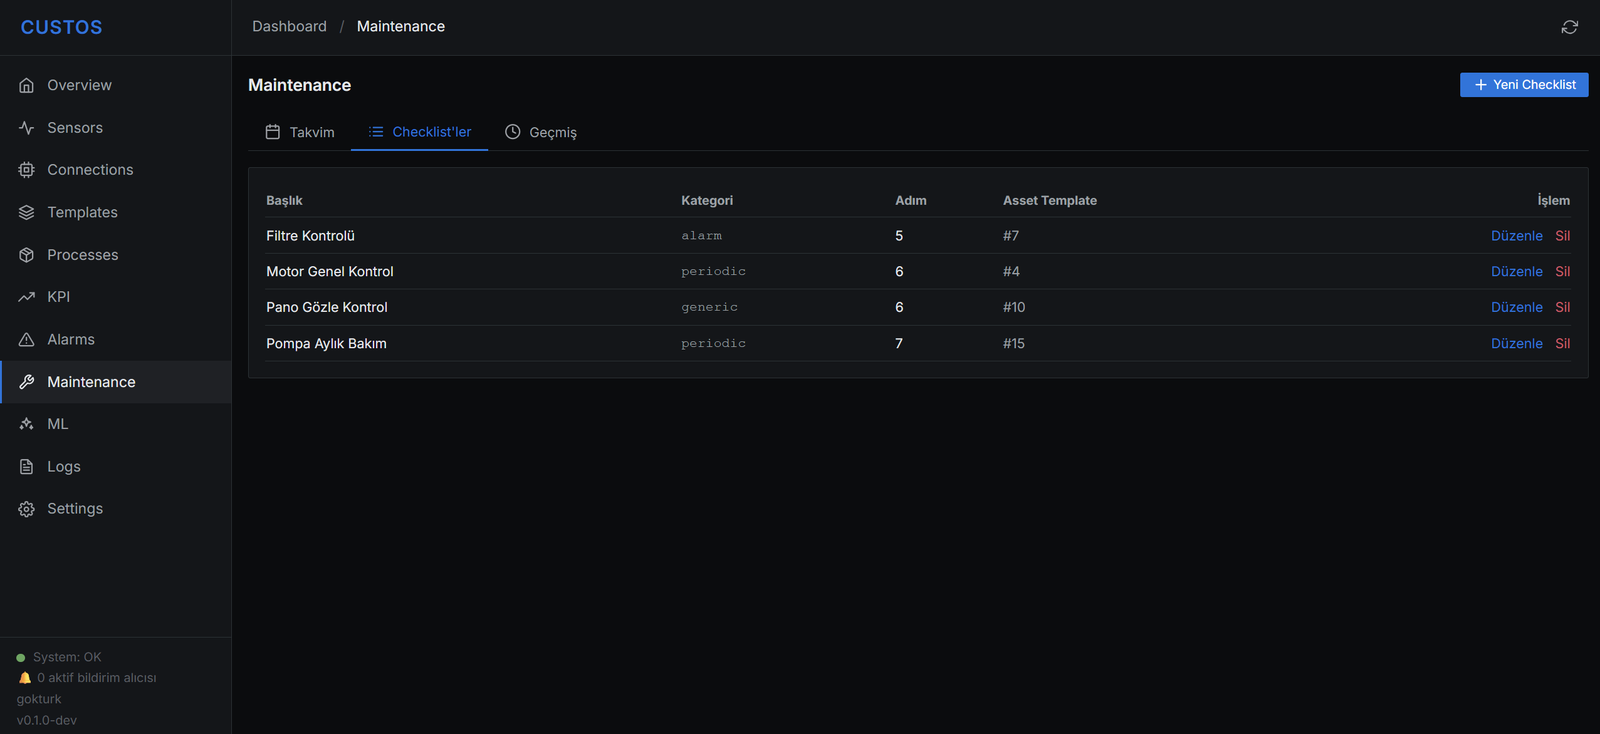
Planned maintenance, in one place.
Periodic checks and maintenance steps are defined as checklists, linked to equipment templates, and added to the calendar. Every action is recorded in history — what was checked and when is always on record.
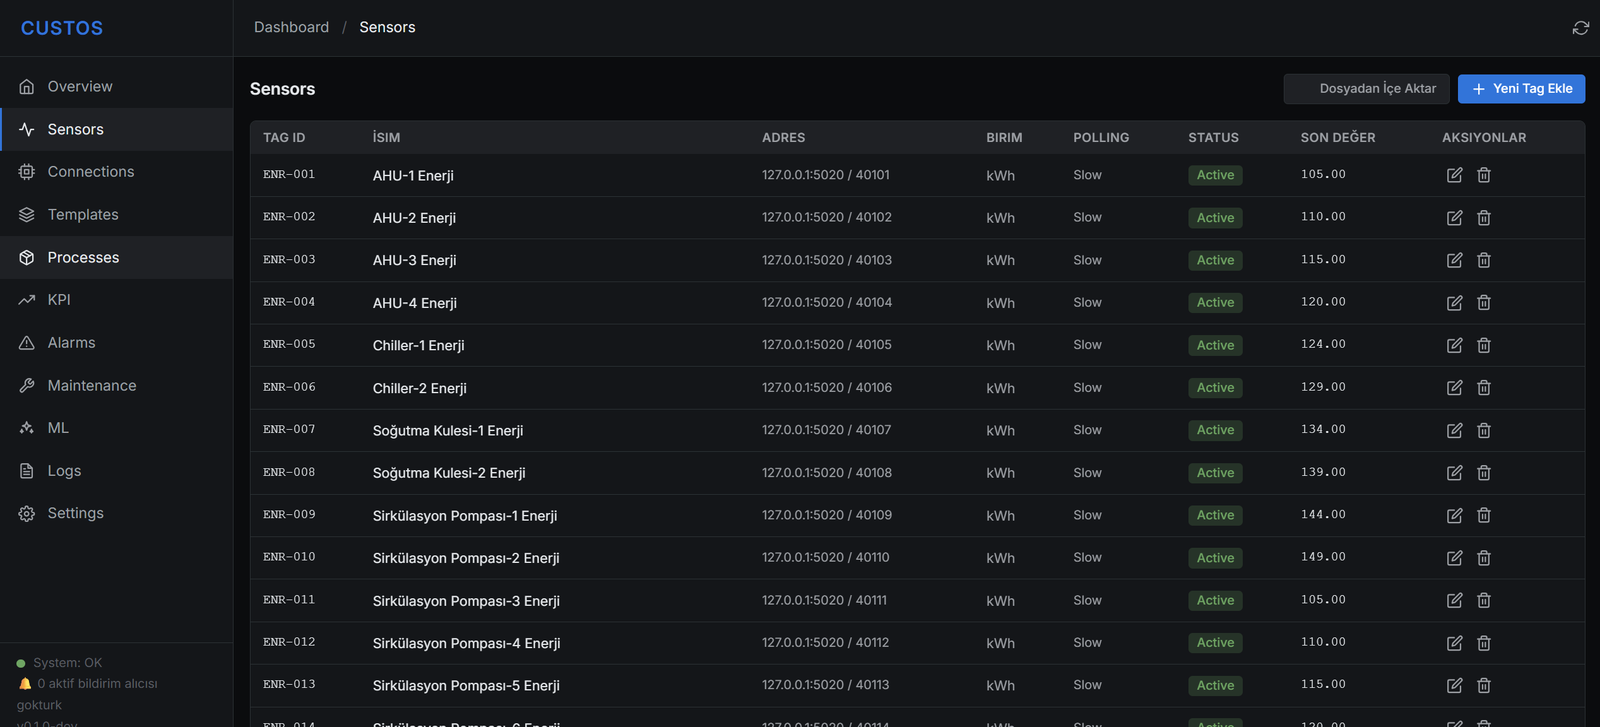
Every monitored point, individually defined.
Each sensor is defined as a read-only tag with its address, unit, and polling rate. Custos only receives data from the field, never sends commands. With bulk import, you bring hundreds of points online in minutes.
See Custos in a live demo.
Let us show you the Custos interface with your facility's own scenarios.